IESE Insight
6 approaches to valuing data
Data drives our modern economy yet remains one of the hardest assets to observe, measure and put a price on. Can the financial tools we use to measure physical capital be applied to data? Let’s do the math and find out.
Think about some of the most valuable firms in the world today — Amazon, Microsoft and Google. What are they most valued for? Their buildings? Their workers? Their technologies? Primarily, it’s their data. And that raises lots of questions that touch on every aspect of finance, from asset pricing (If data is a new kind of asset, how do we value it?) to corporate financing (Do data-intensive firms have valuations that are realistic?) to entrepreneurship (If data serves as an entry barrier for new firms, what does market power look like if digital services are being given away for free?).
Answering these questions isn’t easy, given our reliance on industrial-era economics tools based on using labor and capital for production. The data economy is not the same as the old economy. We need to update our tools. And while some existing financial tools can be used to value data, we must acknowledge there are more open questions than resolved ones, given that data is one of the hardest assets to observe, measure and put a price on. Yet, given its central importance to our modern economy, we must at least try.
In this article, I will suggest six approaches to valuing data and how we might make progress, even with imperfect measurement tools.
The economic nature of data
Data information has been around for centuries, but what’s different now is that data has become digitized. Yet, it’s not just the digitization of data that’s interesting; it’s the rise of big data, such as that generated by AI algorithms based on your search history, your car traffic patterns, your purchases and so on, which exists as a byproduct and as a predictor of economic activity, rather than being a mere input for invention or research. This is a key difference. I’ve never engaged in economic activity and had a research paper appear as a byproduct. Conversely, data does materialize as a consequence of my activities. Moreover, that data asset can be bought and sold in ways that I can’t likewise trade the knowledge assets in my own head.
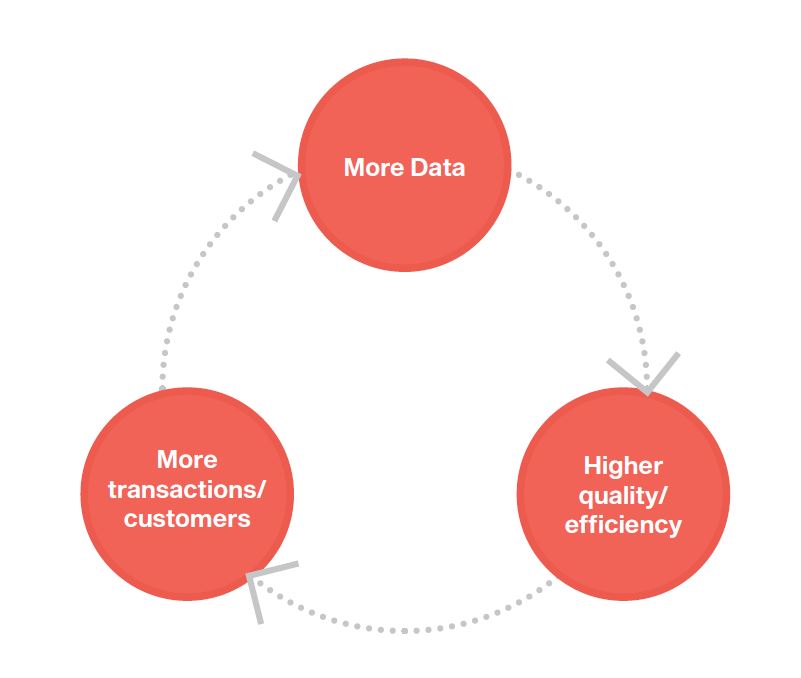
Another key difference between big data and other forms of intellectual property is that it may arise from a barter trade, i.e., you trade your personal information to obtain something for “free” but then the company is able to monetize that information. This is the business model of countless apps. The more transactions there are, the more data is generated and the more money is made, or the higher quality, efficiency or productivity a firm is able to achieve, thanks to your data.
How many red versus purple sweaters will be demanded? How many should I load onto the truck or container ship? How many do I need to keep in stock? Whom should I hire? Which firms should I invest in? These economic decisions are being informed by data. And the more transactions I have and the more efficient or productive I become, the more I can grow and the more profits I can make, in a self-reinforcing feedback loop of increasing returns.

This data economy can be represented in a simple model (see figure). Taking our initial asset (in this case, data), we can presume some depreciation of that data over time, and we can calculate a depreciation value. To offset that depreciation, we must generate more data, so we add some new inflow — more transactions and/or customers (or new capital or labor) and calculate a new asset value. We can also use efficiency ratios to measure our ability to generate income with our data assets in a certain period of time. We can enrich these formulas any way we want, but with simple equations similar to those used to measure a capital stock, this spiral of increasing returns can be calculated mathematically.
There’s a second piece to this, which I alluded to before: how data creates value and raises not just current profits (e.g., through a data-led decision to produce red sweaters instead of purple ones) but future profits, too. Firms with more data get more customers, and more customers, more data — until they become the superstar firm that nobody can compete with. As such, data acts as an entry barrier, creating value by keeping competitors out.
A third way that I want us to think about data creating value is that it reduces risk. Remember that data is information. And having information essentially helps you predict something better or more accurately, which resolves uncertainty and randomness, and thereby reduces risk. This is where we sometimes miss the boat. CFOs may think about data in terms of the first piece: how to raise current profits. Other managers and strategists may focus on data as market power. But few think about how data reduces risk and how to put a price on that.
With this in mind, let’s now look at six approaches to measuring data, derived from various academic work I have done with Simona Abis (Columbia), Juliane Begenau (Stanford), Cindy Chung (Stanford), Jan Eeckhout (Pompeu Fabra), Maryam Farboodi (MIT Sloan), Adrien Matray (Princeton), Roxana Mihet (HEC Lausanne), Thomas Philippon (NYU Stern), Dhruv Singal (Columbia) and Venky Venkateswaran (NYU Stern).


